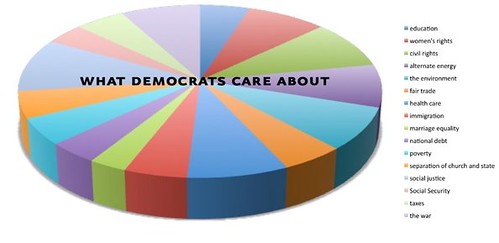
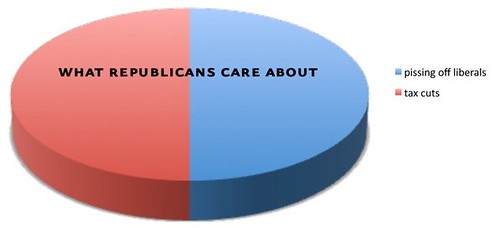
American Politics (in chart form). The charts below are the product of my intense, highly scientific of American partisan politics over the last three election cycles.
This is all you need to know.

(Sadly, we could still go 0 for 3...)
Tuesday, September 09, 2008
Posted by
Gerry Canavan
at
8:41 PM
![]()
Labels: pie charts, politics, satire


|